Handy Market Tracking Chart for Commercial Agents
As this property market takes shape, perhaps even shifts and changes, it is time to watch the indicators. From that process, you will find the people and the properties that can help you boost market share and transaction opportunities.
Trace the people and the properties. Layout your plan of approach into the people and the property situations where you can help with professional commercial real estate services.

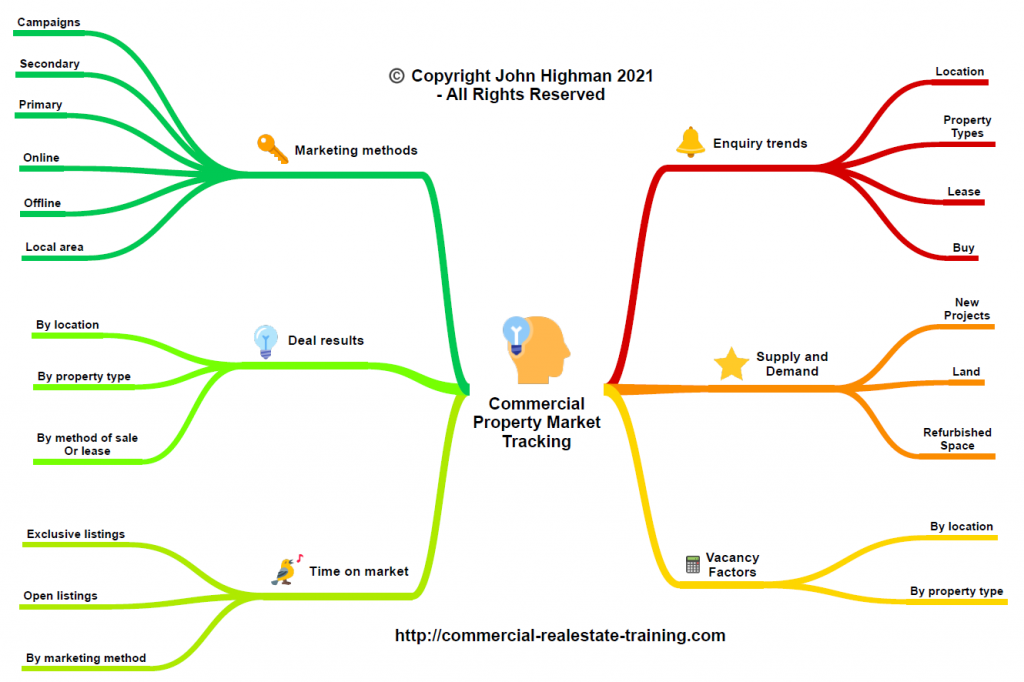
So what is the idea here? The chart gives you the main indicators to watch in your local area and property territory. That will help you figure out where the activities with listings and clients can evolve.
These six main categories will show you what is happening in your local area. That is valuable information for real estate agents and brokers.
Enquiries to Watch
Take one of the key factors such as ‘enquiry trends’. From that fact alone you can watch what people are looking for and that can allow you to align your prospecting efforts more deeply into your local area.
Print off the chart and check out how things change each month or week. Watch the indicators and start chasing the business.
Information will help you get your new business pipeline underway. Give it a try. Get the chart below.